QSO KUV 18217 +6419 :
Un'osservazione al limite strumentale
An observation to the real instrumental limit
Col senno di poi che caratterizza tutte le vicende umane, mi sono chiesto per quali motivi la ripresa CCD di questo oggetto ha messo a durissima prova la mia strumentazione, e perchè io l'abbia ampiamente sottovalutata.Ma l'esperienza contribuisce a far capire ed a far approfondire tutte le cose della vita.Quando ho iniziato a riprendere il Quasar KUV 18217 + 6419, nella costellazione del Drago, ero fermamente convinto che la registrazione dello spettro un oggetto della 14.2 mag non fosse poi così difficile,anche se da un cielo inquinato come quello della città di Roma.Avevo, in fin dei conti, già ripreso altri spettri di Supernove di magnitudine simile e, col mio C14 e la ST8 raggiungevo mediamente la 17^ magnitudine stellare in 2 minuti di integrazione; perchè quindi preoccuparsi?
La realtà , invece si è parecchio allontanata dalla mia convinzione, e, dopo aver registrato 40 frames da un minuto (non avevo trovato stelle di guida in zona) con la predetta strumentazione ed un reticolo di diffrazione " Star Analyser 100" il 29 agosto 21014, in una serata di rara trasparenza del cielo, ho dovuto amaramente constatare che lo spettro, seppur visibile, era illeggibile e quindi inutilizzabile per il basso rapporto S/R, e non c'era la possibilità di estrarne alcuna informazione sullo stato fisico dell'oggetto in questione.
In hindsight that characterizes all human affairs, I asked for what reasons the
CCD imaging of this object put to a severe test my equipment, and because I have
widely underestimated it.But experience helps to understand and learn all
things of life.When I started to image Quasar KUV 18217 + 6419 in the
constellation of the Dragon, I was firmly convinced that the recording of the
spectrum of an object of mag14.2 was not so difficult, although from a
very polluted sky as that of the city of Rome.I had, after all, already
taken other spectra of supernovae of similar magnitude and, with my C14 and the
Sbig ST8 ccd I reached the 17th magnitude star in two minutes of integration; so
why bother?
The reality was quite away from my conviction, and, after recording 40 frames of
1 minute each (I had not found a guide star in the area) with the
above-mentioned instruments and a diffraction grating "Star Analyser 100"on
august, 29 2014, in an
evening of rare transparency of the sky, I had bitterly noted that the spectrum,
though visible, was unreadable and therefore unusable for the low S / N ratio,
and there wasn't possibility to extract any kind of informations on
the physical state of the object in question.
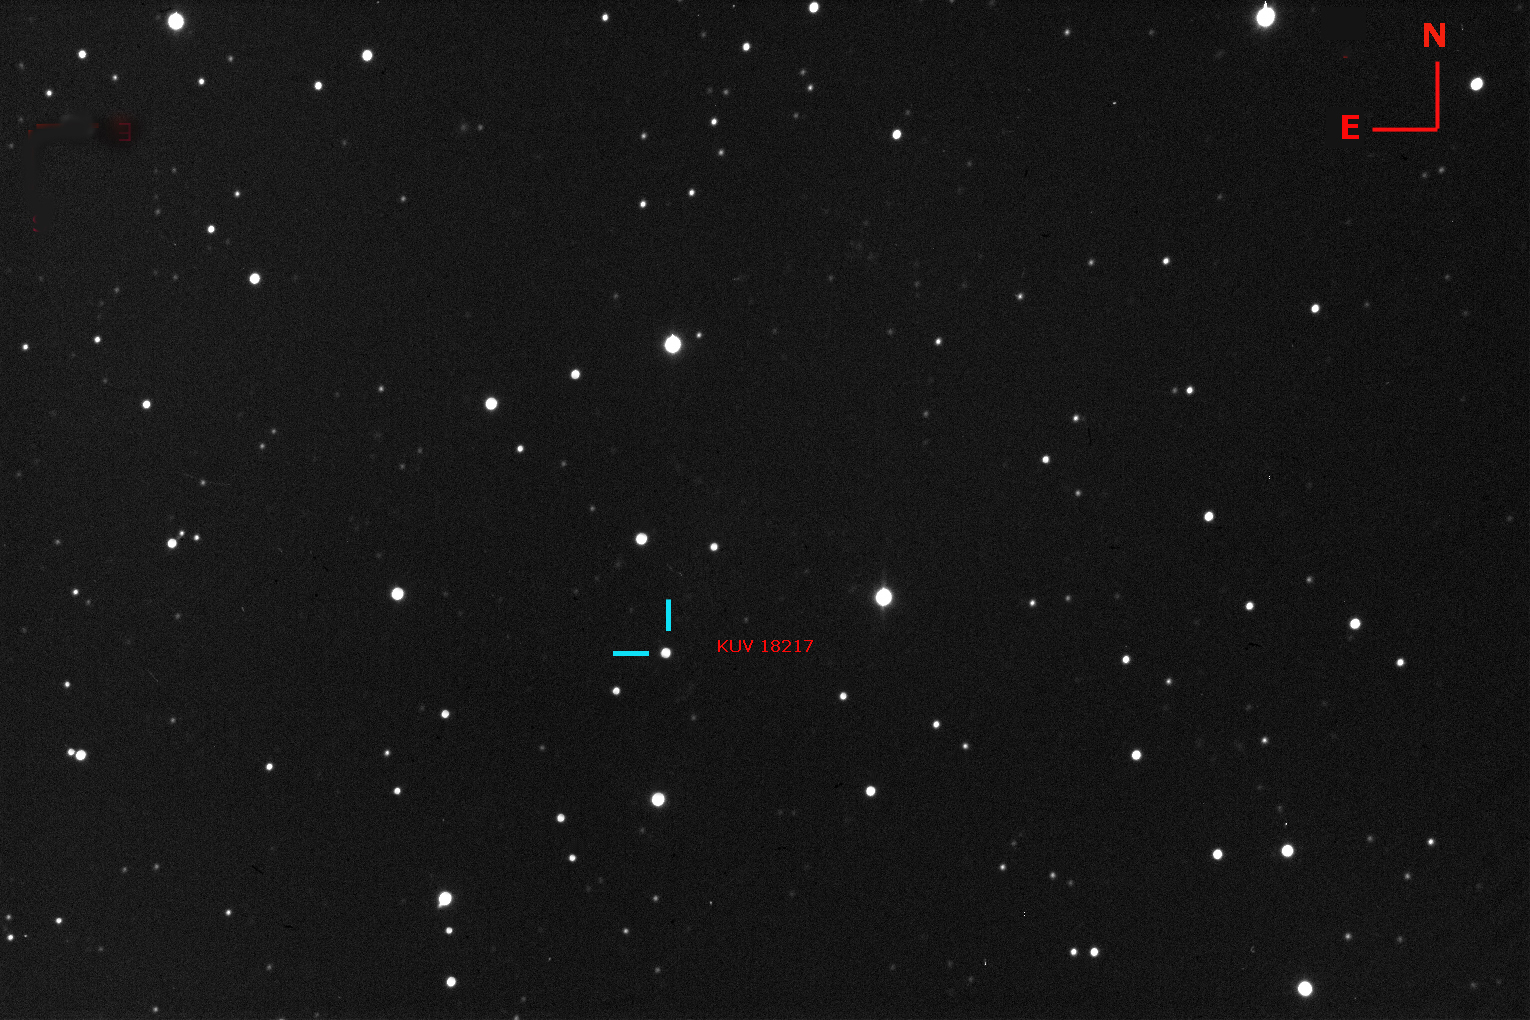
Ma, di che oggetto si parla? KUV 18217 +1649 è un Quasar brillante in Draco, ed uno dei più brillanti della sua classe.Esso fu scoperto nel 1977 come sorgente di raggi X dal satellite HEAO1.L' oggetto era stato ripreso nel 1980 nella survey KISO (KUV) con magnitudine 14.2 .Osservazioni spettroscopiche rivelarono più tardi la sua natura di Quasar con uno spettro di tipo Seyfert 1.La galassia ospite del QSO è una gigante ellittica, classificata come galassia infrarossa iperluminosa (HyLIRG).Sotto un 'immagine da 300 secs del campo del mio C14 @f7 con al centro il QSO con campo di circa 10 x 16 '
But, speaking of what object? KUV 18217 +1649 is a bright Quasar in Draco, and
one of the most brilliant of his class.It was discovered in 1977 as a source of
X-rays from the satellite HEAO1.The object was imaged in 1980 in the survey KISO
(KUV) with magnitude 14.2 .Spectroscopic observations later revealed the nature
of Quasar with a spectrum of Seyfert 1.La the QSO host galaxy is a giant
elliptical galaxy classified as Infrared Hyperluminous (HyLIRG).Hereunder a
300secs image 10 X 16' wide of my Celestron 14@f7 with the
QSO in the center.
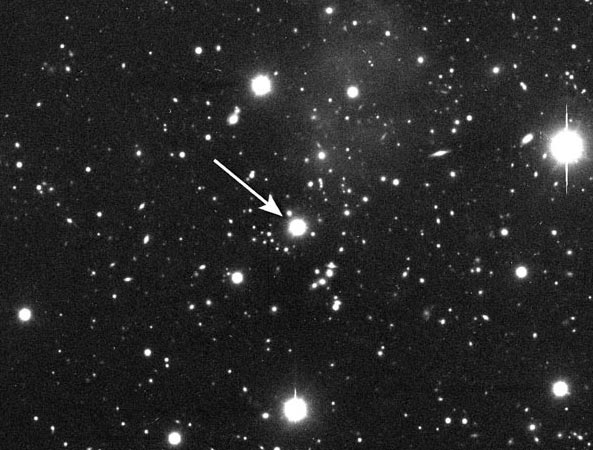
L'immagine che segue, del telescopio WIYN mostra il quasar con , sullo sfondo, l'ammasso di galassie CL 1821 +643 e la nebulosa planetaria diffusa PK 94 +27.1 (credit WIYN Observatory; NOAO, NSF)
The following image (credit WIYN Telescope, NOAO NSF) shows the QSO with the faint galaxy cluster CL 1821+643 and the diffuse planetary nebula PK 94+27.1
Dati dell'Oggetto
Object Data
RA: 18 21 57.2
Dec: +64 20 36
Distanza : 1141 Mpc; 3.721.338.251,26 AL
Mag 14.24
Redshift: 0.297
Dati della strumentazione
Setup data
Celestron 14 f 7 ( 6,3 Meade focal reducer)
Sbig ST8 XME CCD camera
Star Analyser 100
10 Micron GM 2000 Mount
Come dicevo, la prima osservazione del 29 agosto 2014 dal mio Osservatorio di Ponte di Nona, alla periferia di Roma, fu una vera delusione, la somma delle 40 immagini spettrali non mostrava alcun dato, mi riservai quindi di ripeterla al più presto, cosa che feci il successivo 26 settembre , dopo circa un mese.Ai 40 frames originari furono sommati e calibrati con dark e flat altri 48 frames da 60 sec con Astroart, per un totale di 88 minuti di integrazione :quasi 1 ora e mezza, che da un cielo inquinato costituisce una vera sfida.Stavolta però si vedeva qualcosa, anche se molto debole, come confermato da un crop e binning molto forzato dello spettro del QSO estratto dall'immagine spettrale sottostante, in una zona di cielo affollata di stelle.L'immagine spettrale bidimensionale è stata quindi importata in Visual Spec e , dopo aver sottratto il fondo cielo,ne è stato estratto il profilo.Per la calibrazione è stata usata un'immagine dello spettro di Vega, messo a registro col primo.La calibrazione per la risposta è stata effettuata dividendo il profilo del QSO per la curva di risposta ottenuta dallo spettro di Vega.La dispersione ottenuta è stata di 15,4 A/pixel con il reticolo posto a 60 mm dal sensore CCD della camera.
As I said, the first observation from my observatory in Ponte di Nona, on the outskirts of Rome,on august, 29, 2014, was a real disappointment, the sum of 40 spectral images did not show any data, so I promised myself to repeat it as soon as possible, which I did the next 26 September , after about a month.To the previous 40 frames were then added 48 others 60 sec each , combined and and calibrated with dark and flat by Astroart, for a total of 88 minutes of integration: almost 1 hour and a half, that from a polluted sky is a real challenge.This time it was possible to see something, even if very weak, as confirmed by a crop and very forced binning of the spectrum of the QSO extracted from the spectral image below, in an area of sky crowded with stars.The bidimensional image was then imported into Visual Spec and , after subtracting the sky background, it was extracted the profile.In order to perform wavelenght calibration has been used a spectrum of Vega, put in register with the first.The calibration for the inetnsity was performed by division of QSO profile for the one of the intensity curve extracted from the spectrum of Vega.The dispersion was of 15.4 A/Pixel with the grating at 60 mm from the CCD sensor.
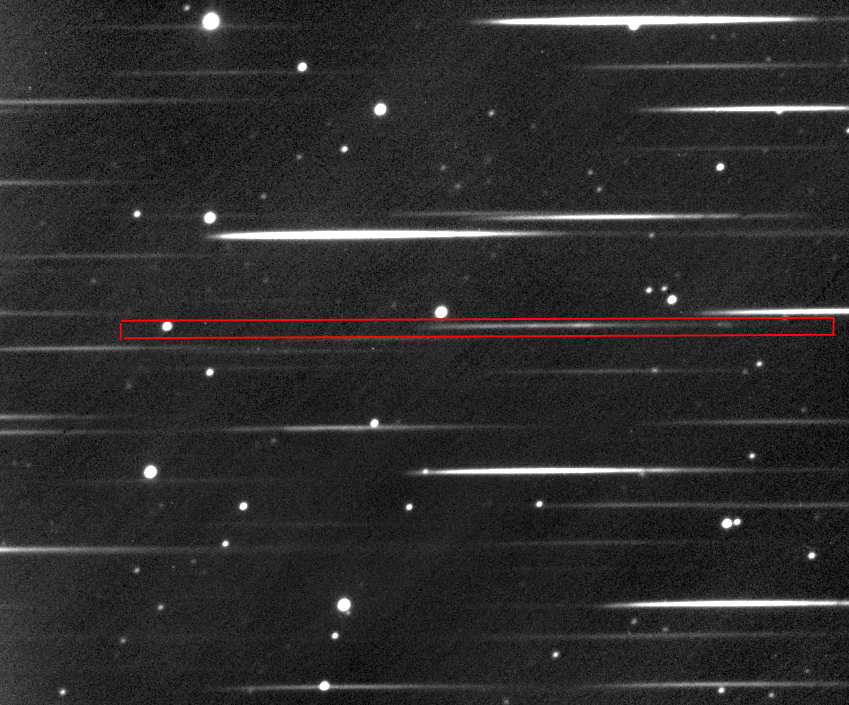

Lo spettro bidimensionale del QSO
Bidimensional QSO spectrum
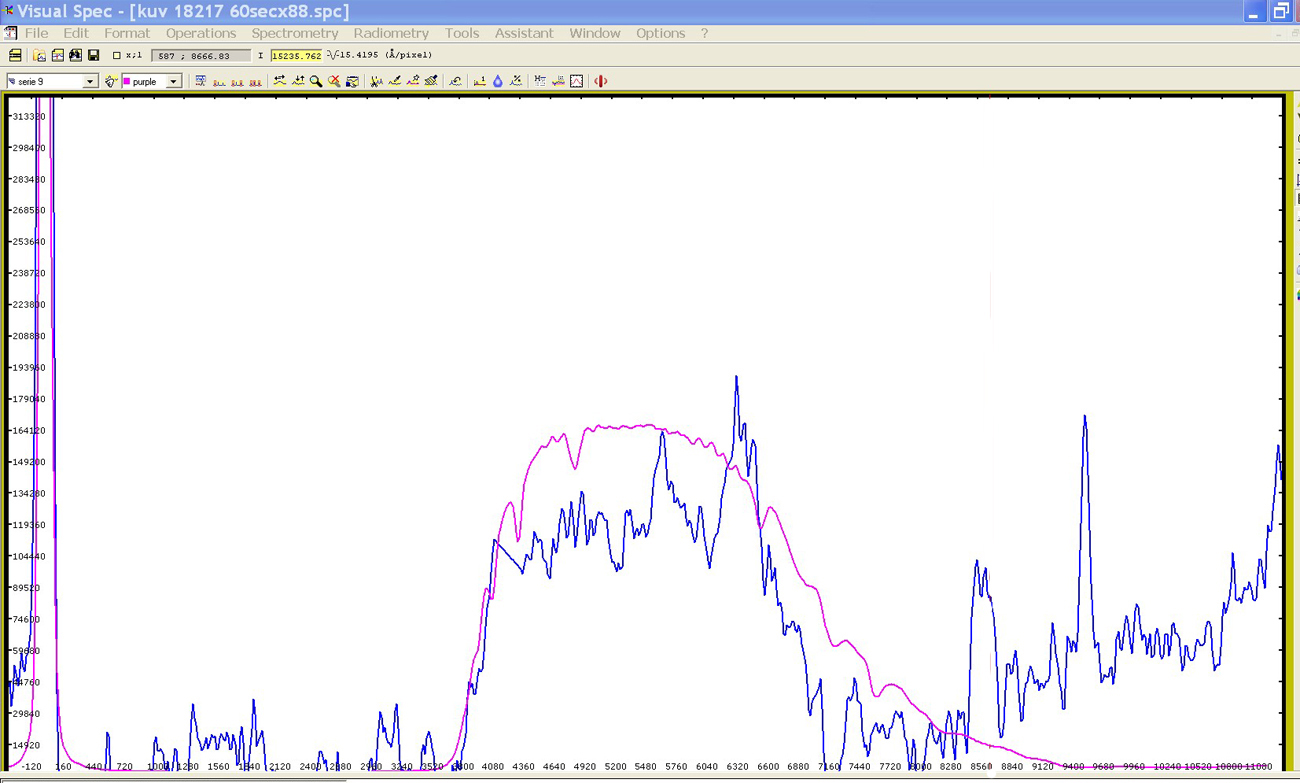
Il profilo spettrale sovrapposto a quello della stella Vega, ripresa nella stessa sera, per la calibrazione in lunghezza d'onda.
The spectral profile overlying that of star Vega, to perform the calibration in wavelenght
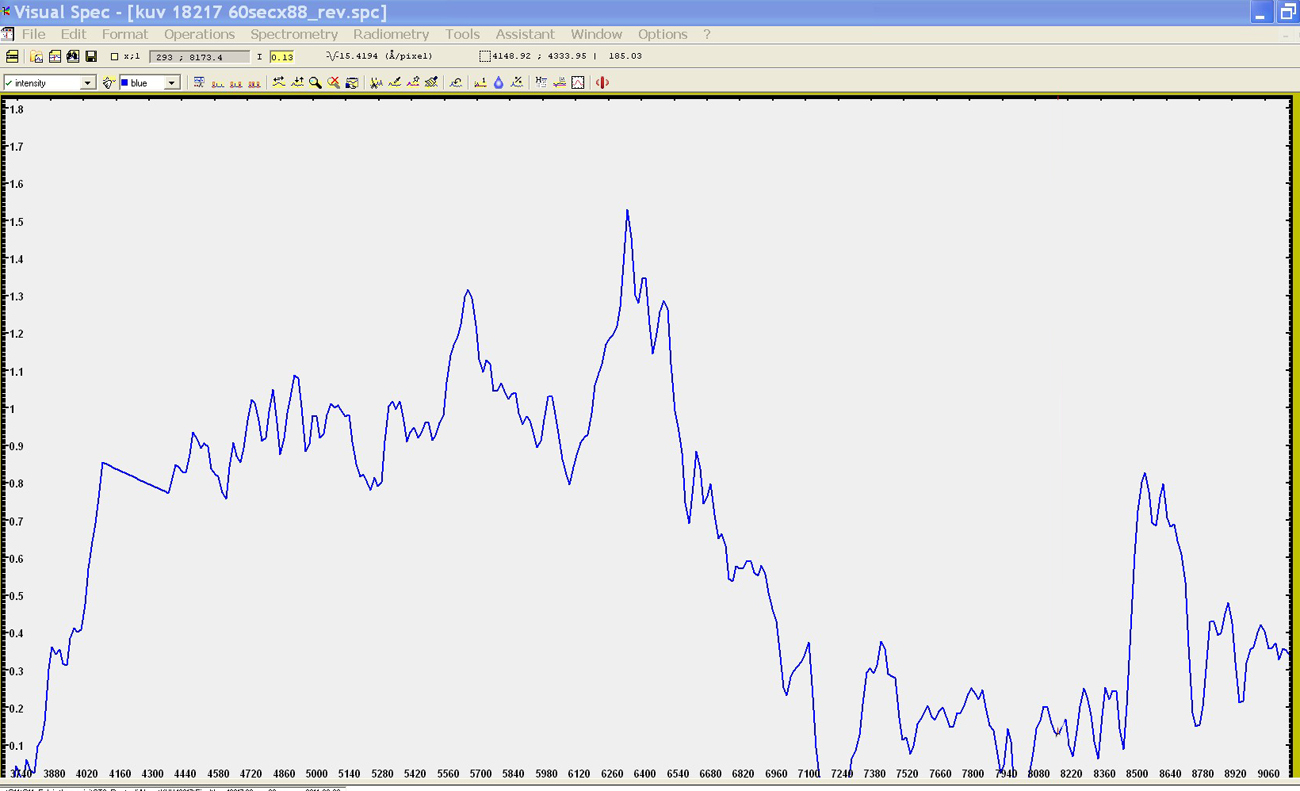
Il profilo spettrale calibrato in lunghezza d'onda
the spectral profile calibrated in wavelenght
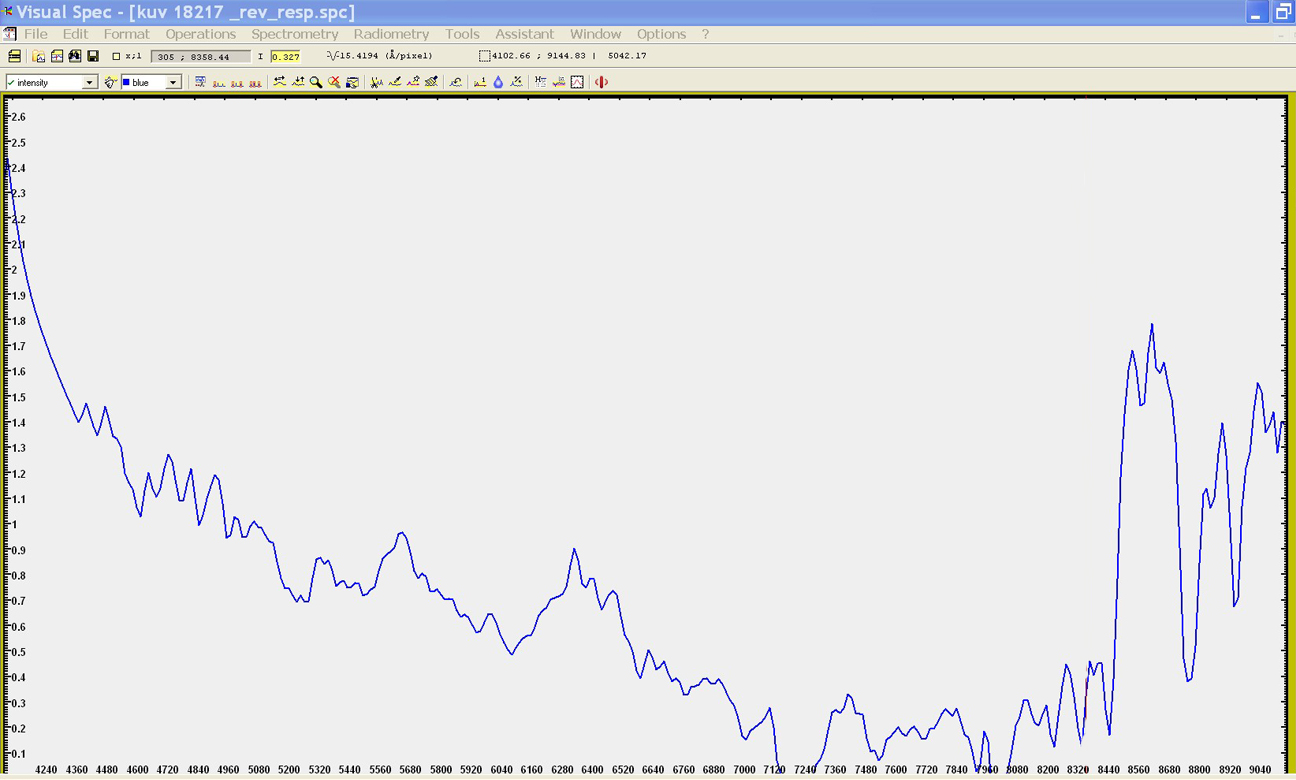
Il profilo calibrato per la risposta
The spectral profile calibrated for intensity and setup response
Da un primo esame del profilo spettrale calibrato risultano i primi problemi:
1- che il fuoco per il visibile non va bene per gli spettri redshiftati, in quanto nell'IR le righe appaiono leggermente fuori fuoco, al punto da sembrare quasi sdoppiate
2- La difficoltà di individuazione delle righe stesse, tenuto conto che l'unico spettro professionale reperibile on line dell'oggetto , al NED (NASA IPAC Extragalactic Database) è nel lontano IR, tra 46 e 200 micron.I dati certi sono quindi 2: il redshift, pari a 0.297, come risulta dal NED stesso. ed il tipo di spettro, comune ad altri QSO, di tipo Seyfert 1,l ovvero quello di con righe allargate alla base e sottili sopra, essenzialmente della serie di Balmer dell'Idrogeno (HG, Hb e Ha) e dell'OIII.Si trattava quindi di individuare tali righe nella loro esatta collocazione nel profilo spettrale del KUV 18217.Ora, sulla base del valore di z del NED, la lunghezza d'onda osservata di tali righe dovrebbe essere, sulla base della formula dL= z x L (dL e L rispettivamente l'incremento di lunghezza d'onda e la lunghezza d'onda a riposo) come segue:
H gamma 4340 + (0,297 x 4340 )= 5629
H beta 4861 + (0.297 x 4861) = 6305
OIII 5007 + (0.297 x 5007) = 6494
Ha 6563 + (0.297 x 6563) = 8512
A questo punto restava che calcolare il centro delle righe più evidenti nel profilo per identificarle con ragionevole certezza, e derivare l'errore contenuto nel profilo del mio spettro rispetto ai dati professionali.La parte più difficile è stata la valutazione della riga Ha, che appariva con una doppia cuspide, a mio avviso dovuto alla leggera sfocatura,od anche al blend con l'NII, presente negli spettri di tipo Seyfert1: comunque ho considerato entrambe le cuspidi nella determinazione del centro riga la riga vicina, a 110 A circa verso l'IR potrebbe essere He1, ma è solo un'ipotesi. I valori in nero rappresentano quelli professionali e quelli in rosso la collocazione delle righe nel mio profilo.La determinazione del centro riga è stata effettuata con l'apposita routine di VSpec.
At an initial examination of the calibrated
spectral profile there were the first problems:
1- that the point of focus for visible was not good for the lines beyond the 7000 A,
as in the IR lines appear slightly out of focus.
2-The difficulty of identifying the lines, taking into account that the
only professional spectrum available on the web, the NED (NASA IPAC
Extragalactic Database) is in the far IR, between 46 and 200 micron.Then the
reliable data were 2 : The redshift, equal to 0.297, as shown by the NED itself.
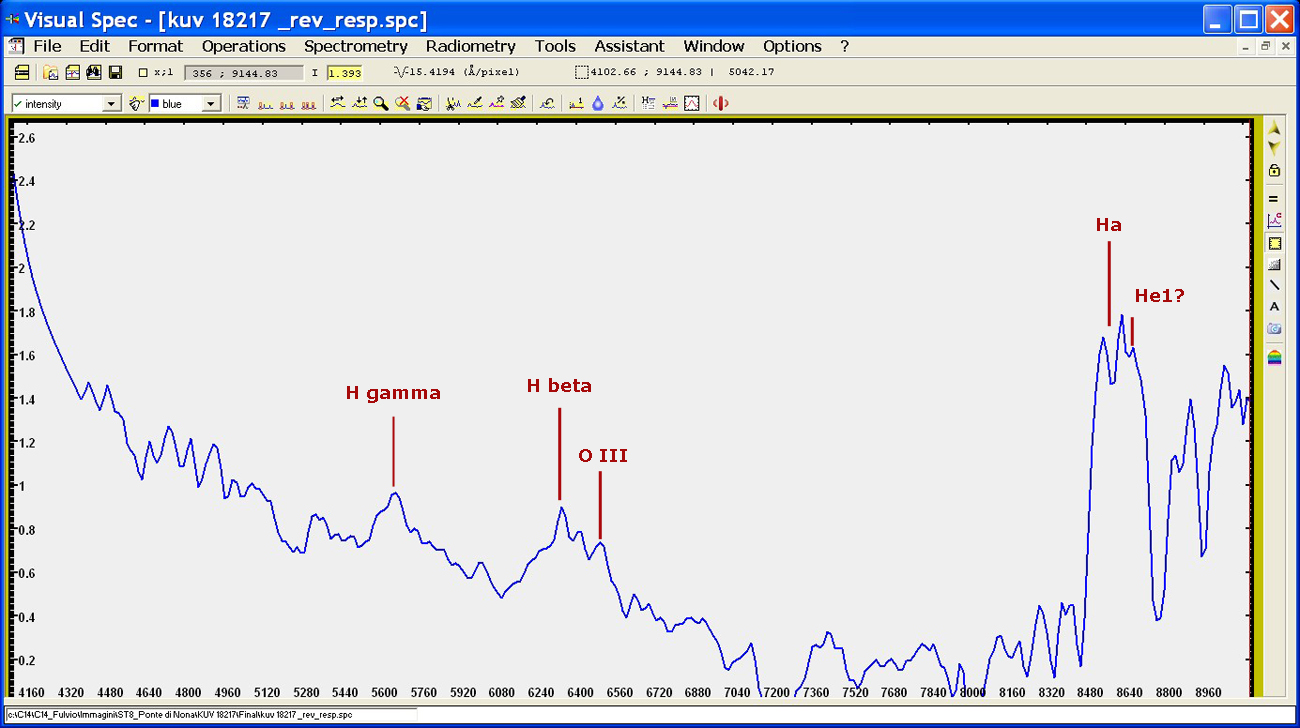
and the type of spectrum, common to other QSO, Seyfert 1, namely that of the
lines profiles widened at the base and thin above, essentially those of the
Balmer series of Hydrogen (HG, Hb and Ha) and of Oxygen OIII, and other
elements such as NII, He I, etc.The most
difficult job was therefore to identify those lines in their exact location in
the spectral profile of the KUV 18217.Now, on the basis of the value of z found
in the NED, the wavelength of these lines should be observed, by applying
the formula dL = zx L (dL and L, being ,respectively, the increase of the
wavelength and the wavelength at rest) as follows:
H gamma 4340 + (0.297 x 4340) =
5629
H beta 4861 + (0297 x
4861) = 6305
OIII
5007 + (0297 x 5007) = 6494
H alpha 6563 + (0297 x 6563)
= 8512
At this point remained to calculate the center of the most evident lines
in the profile to identify with reasonable certainty, and derive the error
contained in the profile of my spectrum compared to the professional data .The
hardest part of the job was the evaluation of the Ha line, which appeared with a
double cusp, in my opinion due to the slight blur, so I considered both the
cusps in the determination of the line center ,the line near this at about 110 A
from it toward the IR could be Helium He1, but it is only a hypothesis. The
values in black represent those professional and those in red the placement of
the lines in my profile.The determination of the center line was performed with
the appropriate routine of VSpec.
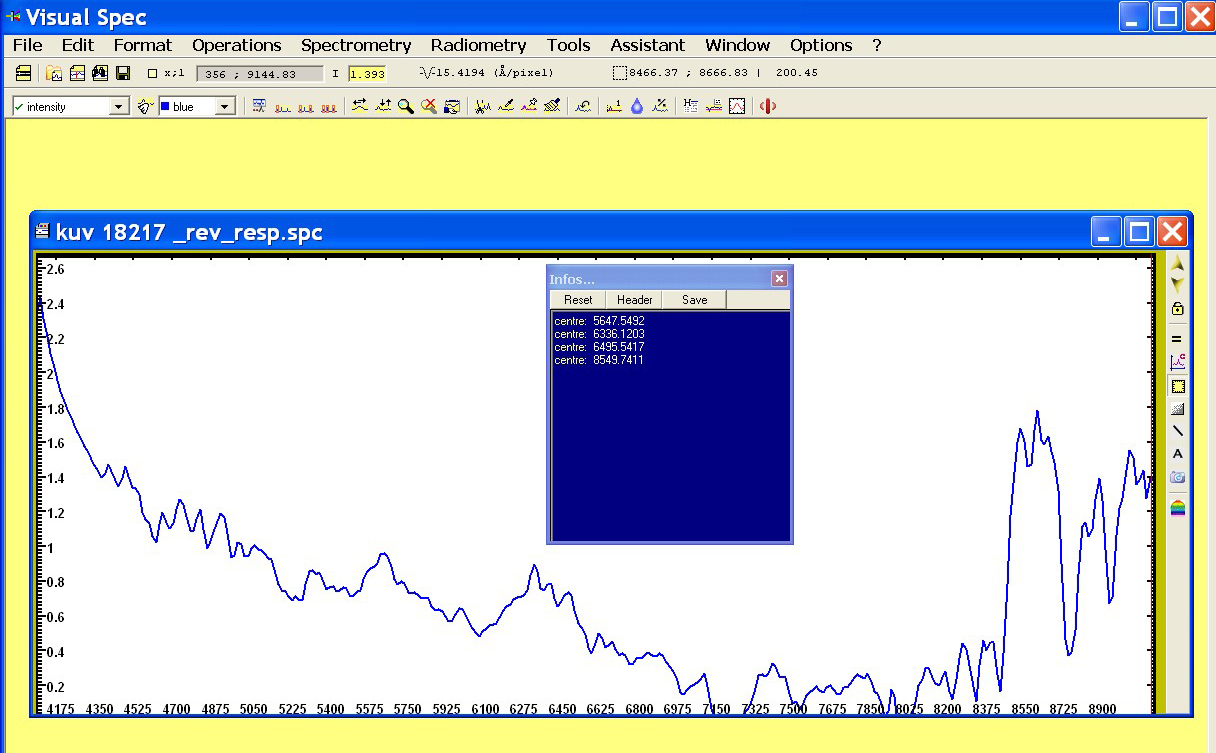
H gamma 5629 5647 +18
H beta 6305 6336 +31
OIII 6494 6495 + 1
Ha 8512 8549 +37
Si trattava, in ultimo, di stabilire il redshift risultante dalla mia osservazione per le singole righe ed il suo valore medio con la solita formula z= dL/L:
It was, at last, to determine the redshift resulting from my observation for the individual lines and its average value with the usual formula z= dL/L:
H gamma dL: (5647 - 4340) 1307 z 0.301
H beta (6336 - 4861) 1475 0.303
OIII (6495 -5007) 1488 0.297
Ha (8549 -6563) 1986 0,302
Il valore di z medio è risultato 0,300 +- 0,002 (errore di 15 A dovuto alla bassa dispersione) L'errore rispetto al valore di z professionale è stato di 0.003, probabilmente in parte dovuto alla non perfetta messa a fuoco IR .
The average value of z was 0.300 + - 0.002 (error 15 A due to the low dispersion) with an error ,respect to the professional z value of 0.003 was , probably ,due to imperfect focusing in the IR part of spectrum.
Un errore di 0,003 nel valore di z sembra accettabile, considerato il limite strumentale amatoriale, avrebbe, tuttavia, potuto esserci un un risultato ancora migliore con una focheggiatura più precisa nell'IR , magari focheggiando con un filtro rosso su una stella luminosa (un IR pass avrebbe poi messo fuori fuoco il visibile).
Tornando poi alla considerazione iniziale circa la difficoltà di registrazione dello spettro, la risposta è semplice e chiaramente visibile nel profilo spettrale corretto per la risposta: la maggior parte dell'energia luminosa delle righe più intense come l'Ha è spostata nell'IR per il redshift, mentre nel visibile questa è bassa: la capacità di registrare lo spettro in questione è stata dovuta esclusivamente alla notevole efficienza quantica del sensore della Sbig ST8, il KAF 1603 con microlenti, nella parte infrarossa che è di ben il 35% a 8500 A. Probabilmente con sensori con minore QE in questa parte dello spettro non sarei riuscito ad ottenere uno spettro leggibile dell'oggetto da Roma.
An error of 0.003 in the value of z seems
acceptable considering the instrumental limit of anamateur, however,it
could be a even better result with a more precise focusing a in the IR,
maybe focusing with a red filter on a bright star (an IR pass would then put out
of focus the visible).
Returning then to the initial consideration about the difficulty of recording
the spectrum, the answer is simple and clearly visible in the spectral profile
corrected for instrumental response : most of the light energy of the
intense lines such as Ha is shifted in the IR for the redshift, while in the
visible it is low: The ability to record the spectrum in question was
exclusively due to the high quantum efficiency of the sensor SBIG ST8, the KAF
1603 with microlenses, in the infrared zone high as 35% at 8500 A .
Probably sensors with lower QE in this part of the spectrum would not be able to
get a spectrum of the object from Rome.